
How to Animate an Architecture Diagram
By Rajeev Ranjan · Updated November 2026 · 6 min read
A static architecture diagram shows what is connected. An animated one shows what happens: a request enters the gateway, fans out to services, and ends up in a database. That is much easier to follow in a design review, a README or a conference talk, and it takes about five minutes to make.
This guide uses DiagramPulse, which is free, needs no account, and runs entirely in your browser, so your diagram is never uploaded. You will build the diagram, make the connections move, add numbered steps, and export it as a GIF, a video or an SVG.
Step 1: Start from something, not from nothing
Open the editor and pick whichever start suits you:
- A template. Press Templates and choose Cloud architecture or Data pipeline. Every box and arrow is editable, so treat it as a starting point.
- Type it. Press ⌘K (or Ctrl+K) for Quick build and type something like
web app -> api gateway -> orders service. The boxes appear, connected and laid out. The Quick build guide covers the syntax. - A drawing you already have. Paste from Excalidraw or open a screenshot and rebuild it as a clean diagram. See importing from Excalidraw or a screenshot.
- A blank page. Use New and choose a page shape: widescreen 16:9, standard 4:3, square, or vertical.
Step 2: Add your services and give them logos
Press R and click the page to add a box, or simply double-click an empty spot. Type the service name. If it is a well-known one, such as Postgres, Kafka, Redis, Docker or WhatsApp, the box picks up its logo automatically. There are about 120 icons to choose from (92 brand logos and 29 generic ones), and you can search them from the Icon field in the side panel.
The same panel lets you change the shape (box, square, diamond, oval, database or hexagon), the colour, and the size. Databases look right as a Database cylinder; decisions read well as diamonds.
Keep it readable
Aim for five to nine boxes in one diagram. If you need more, split it into two animations, such as the request path and the data path, rather than shrinking everything.
Step 3: Connect the boxes
Select a box and four small + handles appear around it. Drag one onto another box to connect them, or drag it into empty space to create the next box and connect it in one move. Connectors stay attached to their boxes, so you can rearrange freely afterwards and the arrows follow.
Prefer to draw arrows directly? Press 1 for a straight arrow, 2 for a curved one, 3 for an elbow, or 4 for a line with several bends. When you drag near a box, the end snaps to the middle of the nearest side and the box lights up to show it will attach. Hold Alt if you want to place an end freely instead.
Step 4: Decide how the flow moves
Click any arrow to open its Flow settings. The quickest route is a preset:
- Neon: bright glowing dots, the classic look.
- Subtle: calm and professional, good for documents.
- Data stream: streaming dashes, nice for pipelines.
- Ping: rippling pulses, good for events and messages.
- Marching ants: a dashed line that crawls along the arrow.
- Fast lane: busy, high-throughput traffic.
Underneath, you can fine-tune the animation style (particles, laser or pulse), how many dots there are (1 to 10), their size, the speed (0.5× to 3×) and the glow. Use a different colour or speed on important paths, for example a busy main path and a slow background job, so the picture itself communicates the difference.
Step 5: Add context with a heading and numbered steps
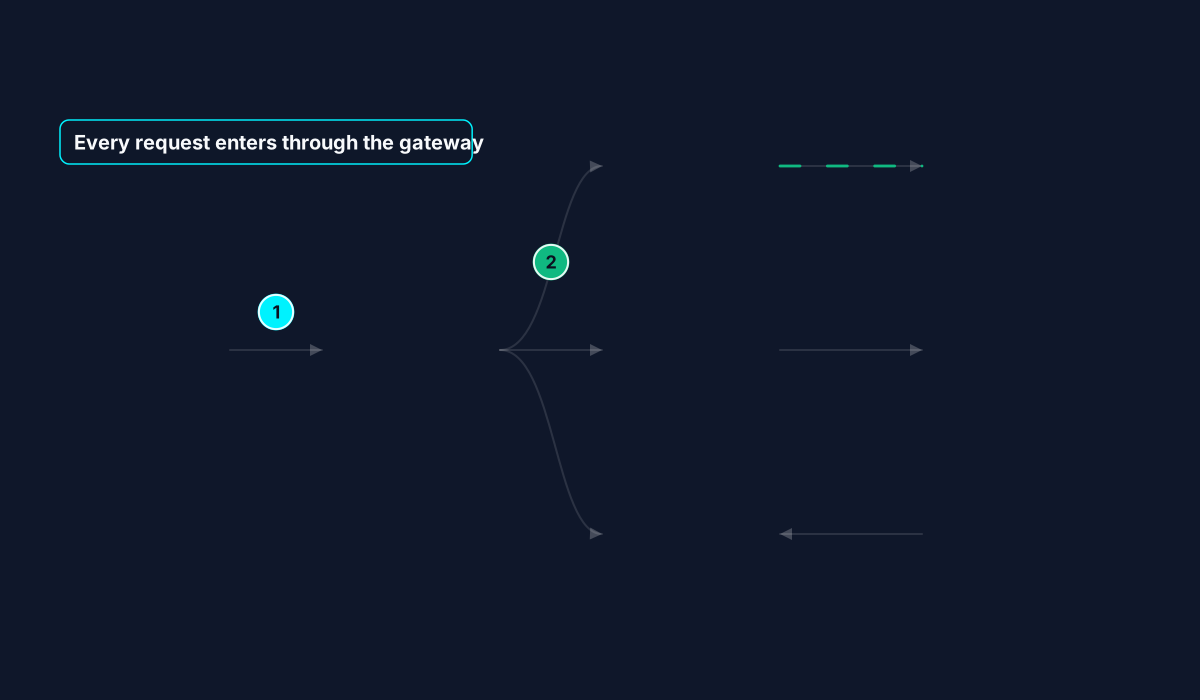
Animation shows movement, but labels tell the story. Press G to add a heading (a title with an optional subtitle). Press N and click to drop numbered step badges, which count up automatically, so you can mark the request path 1, 2, 3. Press B and drag to draw a pulsing highlight box around a group, such as a data tier or a trust boundary, and give it a short caption. Press T for a plain text label. Double-click any of them to edit.
Step 6: Export
Choose Export Animation, pick a format and press render. As a rule of thumb: GIF works everywhere, MP4 is the sharpest and smallest for slides and social, and SVG is a tiny vector file for documentation. The format comparison goes into the trade-offs, and the slides guide shows how to use the result in a presentation.
The loop length is set in the bar under the canvas (2, 3, 4 or 5 seconds), and the export repeats seamlessly. Whole-number speeds repeat exactly. If a flow uses a half-step speed such as 1.5×, the export automatically runs for two loops so the join is invisible.
Making it look professional
- One message per diagram. Animate the path you are explaining and keep the rest calm.
- Use colour to group, not to decorate. One colour per layer (edge, services, data) is easier to read than a rainbow.
- Slow down. Viewers need time to follow a dot. If in doubt, lower the speed or lengthen the loop to 4 or 5 seconds.
- Short labels. A name and a three-word subtitle, such as Auth service · OAuth, JWT, is plenty.
Questions
Do I need an account?
No. There is nothing to sign up for.
Is my diagram uploaded anywhere?
No. Everything, including exporting, happens in your browser. Your latest work is kept in your browser's own storage so it is there when you come back.
Can I edit it later?
Yes. The editor keeps your latest diagram on your device, and the whole thing stays editable until you start a new one. Export the format you need whenever you want a fresh copy.