
Teach a Process Step by Step with an Animated Diagram
By Rajeev Ranjan · Updated November 2026 · 6 min read
Cycles and processes, such as the water cycle, a sales funnel or how a request moves through a system, are hard to explain from a still picture, because the learner has to work out the order and the direction for themselves. An animated diagram with numbered steps does that for them. This guide shows how to build one for a lesson, a talk or a handout, using the built-in water cycle as the example.
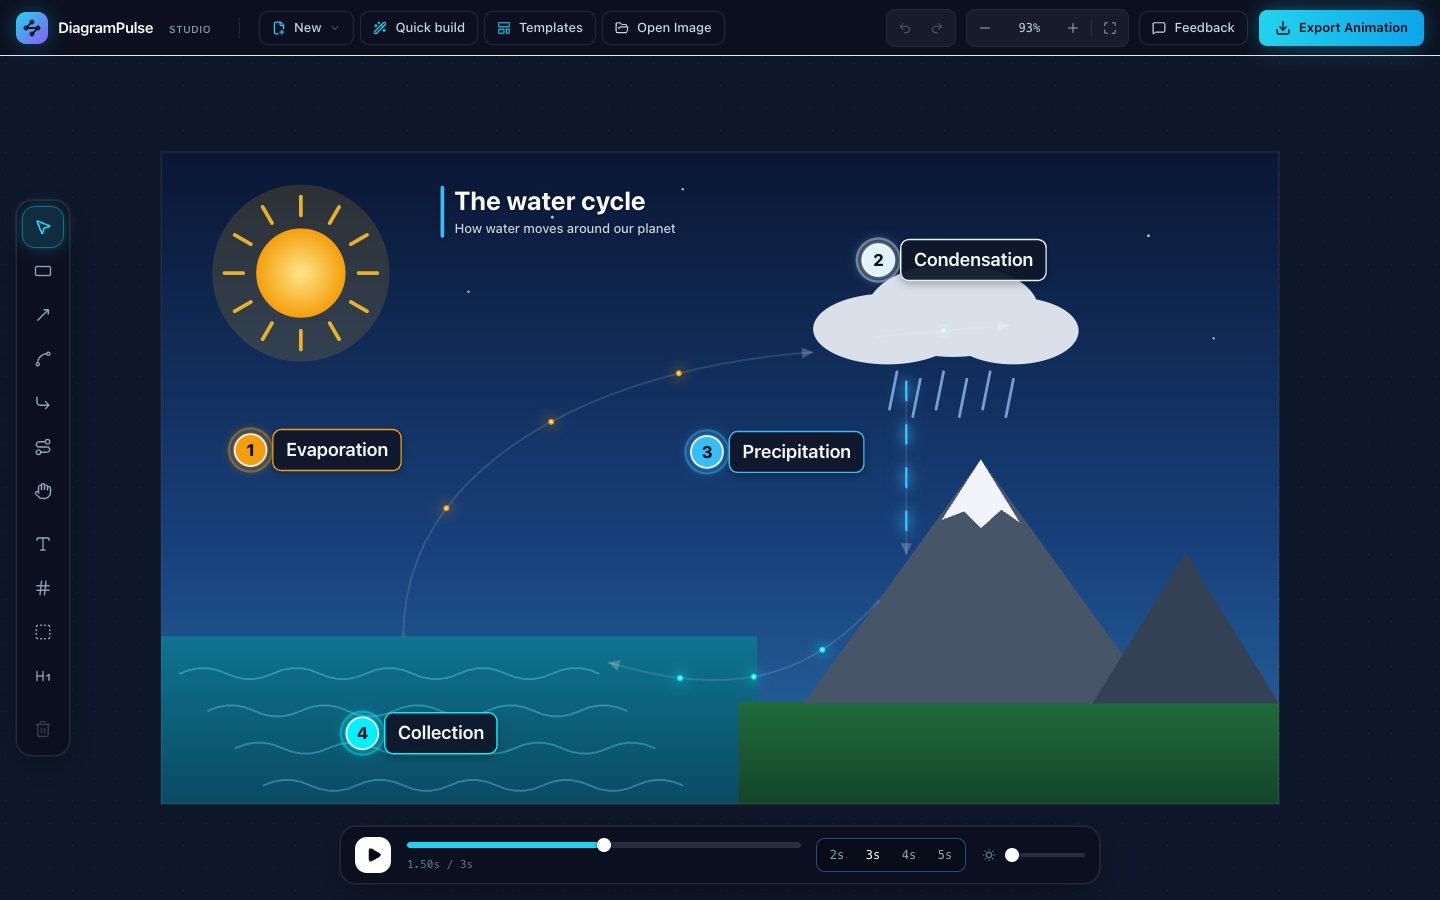
Start from a template you can change
Open the editor and press Templates. For teaching, three of the six are useful starting points:
- The water cycle: an illustrated scene with four numbered stages, ready for a science lesson.
- Process flowchart: five steps from idea to launch, with a review loop back. Good for any step-by-step procedure.
- Customer journey: five stages from first contact to loyalty, with a referral loop. Good for business classes.
Every template is editable, including its heading. Press G, then change the title and the optional subtitle in the side panel, for example “The water cycle” and “How water moves around our planet”.
Number the steps, in the order you will teach them
The numbered circles in the picture are step badges. Press N and click where the step happens. The badge takes the next number automatically, so you add them in teaching order and they count up on their own. Each badge pulses gently in the animation, which draws the eye to the step. Pair each one with a short text label (key T), such as “Evaporation”.
Click a badge or a label to change its colour or size. Using a different colour for each stage helps learners keep them apart without reading.
Point at what matters with a highlight box
Press B and drag to draw a highlight box: a softly pulsing dashed rectangle. It is ideal for “look here” moments, for example around the cloud while you explain condensation, or around a team on an org chart. Give it a short caption and it sits just above the box.
Because highlights pulse, they are best used sparingly: one or two per diagram.
Set the pace for learners
- Loop length: choose 4 or 5 seconds (the buttons under the canvas) so there is time to follow each movement.
- Speed: select an arrow and lower its speed to 1× or 0.5×. Half-step speeds make the export span two loops so it still repeats cleanly.
- Style: the Subtle preset is calm and works well in a classroom; Neon suits a more energetic talk.
- Direction: the arrowhead and moving dots show which way things go. Check that every arrow points the way your story runs.
Use it in the lesson
- In slides: export a GIF (the Balanced size is right for most classrooms) and follow the slides guide to insert it.
- On a worksheet or website: export an SVG, which stays sharp at any size and is tiny. See the format guide for where it will and will not animate.
- In a video lesson: export an MP4 and put it in your editing software.
Making it accessible
- Do not rely on colour alone. Every stage has a number and a text label, so learners with colour-vision differences are not lost.
- Keep text large and short. A word or two per label reads from the back of a room.
- Describe it in words too. When you publish the diagram, add a sentence or a list that gives the same steps in text, which also helps screen-reader users and search engines.
- Avoid fast motion. Slow loops are kinder to everyone, including people sensitive to movement.
Ideas for your own diagrams
- A food chain, with arrows pointing from the eaten to the eater.
- The steps of a scientific experiment, or an algorithm such as a sort.
- How a bill becomes law, or a supply chain from farm to shop.
- A network request, from browser to server and back. The Quick build guide shows how to type that in seconds.